Designing an Effective Infographic for Social Media
- By -Lepage Kathy
- Posted on
- Posted in Commercials
Infographics are a powerful tool for conveying complex information quickly and engagingly. When designed well, they can capture attention, simplify data, and enhance your social media presence. This guide will walk you through the process of designing an infographic and effectively posting it on social media to maximize your impact.
Understanding the Power of Infographics
Infographics combine visuals and text to present information in a way that is easy to understand and share. They are particularly effective on social media because:
- Visual Appeal: Infographics attract attention with their colorful and structured format.
- Shareability: They are highly shareable, increasing the potential for your content to go viral.
- Information Retention: People tend to remember information better when it is presented visually.
Define Your Objectives
Before you start designing your infographic, it’s important to define your objectives. Ask yourself:
- What is the purpose of this infographic?
- What key message do I want to convey?
- Who is the target audience?
Clear objectives will guide your design process and ensure your infographic achieves its intended purpose.
Research and Gather Data
An effective infographic is based on accurate and relevant data. Conduct thorough research to gather the information you need. Use reliable sources and ensure your data is up-to-date. Organize the data logically to tell a coherent story.
Choose a Topic and Title
Select a topic that resonates with your target audience and aligns with your objectives. The title of your infographic should be catchy and informative, giving viewers a clear idea of what to expect.
Plan the Layout
A well-organized layout is crucial for an effective infographic. Sketch a rough draft of the layout, deciding where each piece of information will go. Consider the following elements:
- Headline: Place it at the top to grab attention.
- Sections: Break down the information into clear sections with subheadings.
- Visuals: Decide where to place charts, icons, and images to support the text.
- Flow: Ensure the information flows logically from one section to the next.
Design the Infographic
Now it’s time to bring your infographic to life. Use a design tool like Canva, Adobe Illustrator, or Piktochart. Follow these design tips:
- Color Scheme: Choose a color scheme that matches your brand and is visually appealing.
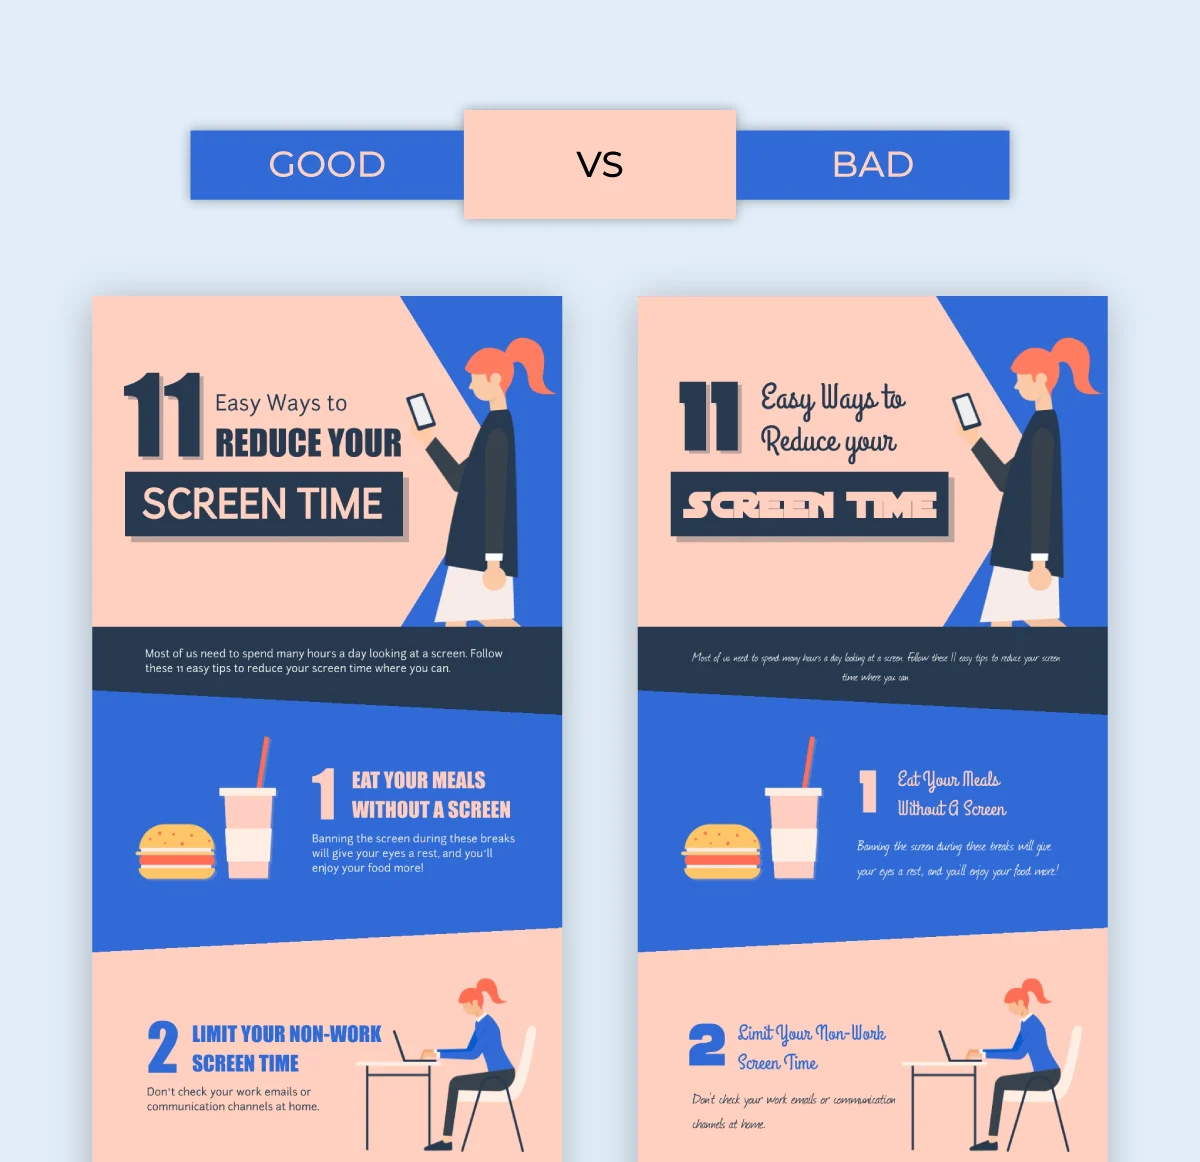
- Typography: Use readable fonts and maintain consistency in font styles and sizes.
- Icons and Images: Use high-quality icons and images that enhance the message without cluttering the design.
- Charts and Graphs: Incorporate charts and graphs to present data visually. Make sure they are easy to understand.
- Whitespace: Use whitespace effectively to avoid overcrowding and make the infographic easy to read.
Review and Edit
Before finalizing your infographic, review it carefully. Check for:
- Accuracy: Ensure all data is correct and sources are cited if necessary.
- Clarity: Make sure the information is clear and easy to understand.
- Design Consistency: Check for consistency in colors, fonts, and styles.
- Grammar and Spelling: Proofread the text for any grammatical or spelling errors.
Ask for feedback from colleagues or friends to get a fresh perspective and make any necessary adjustments.
Optimize for Social Media
Different social media platforms have different specifications for images. Optimize your infographic for each platform by considering the following:
- Size and Dimensions: Adjust the size and dimensions to fit the requirements of each platform (e.g., square for Instagram, vertical for Pinterest).
- File Format: Use high-quality file formats like PNG or JPEG.
- File Size: Ensure the file size is not too large to avoid slow loading times.
Post on Social Media
Now that your infographic is ready, it’s time to post it on social media. Follow these steps for maximum engagement:
- Write a Compelling Caption: Write a caption that complements the infographic, includes relevant hashtags, and encourages interaction (e.g., asking a question or prompting users to share).
- Tag Relevant Accounts: Tag influencers, partners, or relevant accounts to increase visibility.
- Schedule Your Post: Choose the optimal time to post based on when your audience is most active.

Promote and Engage
Once your infographic is live, promote it to ensure it reaches a wider audience:
- Share Across Platforms: Post the infographic on all your social media channels.
- Engage with Your Audience: Respond to comments and messages promptly to build engagement.
- Boost Your Post: Consider using paid promotion to boost your post and reach a larger audience.
Analyze Performance
After posting your infographic, analyze its performance to understand its impact:
- Engagement Metrics: Track likes, shares, comments, and views.
- Reach and Impressions: Measure how many people saw your infographic and how often.
- Website Traffic: Monitor any increase in website traffic from the infographic.
Use this data to refine your future infographic designs and posting strategies.
Conclusion
In conclusion, designing and posting an effective infographic on social media can significantly enhance your brand’s visibility and engagement. By following this step-by-step guide, you can create infographics that not only look great but also deliver your message effectively. Remember to define your objectives, conduct thorough research, plan your layout, and optimize for social media. With careful planning and execution, your infographics can become a powerful tool in your social media marketing arsenal.


